A sentence and a chart
On 10 October 2026, Elon Musk put one sentence on X: “Electricity production is the best metric for the true strength of any large-scale economy imo.”[1]
He was quoting the venture-capital firm a16z, which had posted a chart under the words “Energy capacity = economic capacity, in one chart. There are no low electricity, rich countries.”[1] When we read the post on 12 October it had been viewed 4.5 million times.
Elon Musk · X · 10 October 2026
“Electricity production is the best metric for the true strength of any large-scale economy imo”
4.5 million views when we read it on 12 October.
The post he quoted · a16z
“Energy capacity = economic capacity, in one chart. There are no low electricity, rich countries.”
The chart plots each country’s electricity use per person against its income per person, on logarithmic scales, with one region marked “There are no low electricity, rich countries.”
The “imo” matters: it marks the sentence as an opinion, and it is one. But it points at something you can test. If a country’s wealth and its electricity use rise together, then a technology that needs a great deal of electricity will push on the grid wherever it spreads. Artificial intelligence is such a technology. So the question for this article is a practical one: how much electricity will AI ask for, and what does that mean for India?
Alongside the post came a second item: a colourful chart, supplied with a link to a ChatGPT conversation, titled “Total Primary Energy Consumption (TWh), 2001–2051”. It shows India’s line shooting upward, passing the United States in 2026 and China around 2041, to roughly 60,000 TWh by 2051. It is a striking picture and a flattering one for India. We checked it in section 5, against the energy agencies’ own tables. Short version: it gets the direction right and the scale wrong, and the real story is both smaller and more interesting.
Energy is not electricity
The post and the chart measure different things, so it is worth separating them first.
Total energy counts everything a country burns or harvests: petrol and diesel for vehicles, gas for cooking, coal in steel and cement, wood and dung for household fires, and the fuel that power stations burn. Electricity is one form that energy takes after it has been converted and sent down a wire. In 2025, electricity generation was about a fifth of total energy supply in India (19%), in China (23%) and in the United States (17%), and across the world (19%).[2]
China · electricity is 23% of the total
- All energy45,054
- Electricity generated10,583
United States · electricity is 17% of the total
- All energy26,064
- Electricity generated4,520
India · electricity is 19% of the total
- All energy10,861
- Electricity generated2,082
2025, in terawatt-hours (TWh). “All energy” is total energy supply: oil, gas, coal, nuclear, hydro, wind, solar and the rest. Source: Energy Institute and Ember data as published by Our World in Data, updated 30 June 2026. World totals: 166,754 TWh of energy, 31,772 TWh of electricity (19%).
That is why Musk’s measure and the chart’s are not interchangeable. AI does not run on petrol. It runs on electricity, so the figure that matters for AI is electricity demand, not total energy. We will use both, and say which one we mean.
The units, once
Electricity is counted in kilowatt-hours (kWh), the unit on a household bill. Whole countries use terawatt-hours (TWh), a billion times larger. A separate unit, the gigawatt (GW), measures how fast power is drawn at a moment, not how much is used over time.
kWh
1
What a household bill counts. One kilowatt-hour runs a 1,000-watt heater for an hour.
MWh
1,000 kWh
A thousand of those bill units.
GWh
1 million kWh
A thousand megawatt-hours.
TWh
1 billion kWh
How whole countries and whole industries are counted. The IEA expects the world’s data centres to use about 950 of these in 2030.
Power and energy are different things. A gigawatt (GW) is a rate, like litres per second; a terawatt-hour is an amount, like litres in the tank. The IEA says 2 GW of Indian data centres in mid-2024 used electricity equivalent to 6.5 million Indian households.
Why AI is hungry
When you ask an AI service a question, nothing happens inside your phone beyond sending and receiving. The work is done in a data centre: a warehouse of specialised chips that perform enormous amounts of arithmetic, with cooling and power equipment around them. Every answer you receive started as electricity.
You ask
A question, a picture, or a task for an agent.
An AI service
Software that turns the request into a lot of arithmetic.
A data centre
Thousands of chips, plus the cooling and power equipment to keep them running.
The grid
Wires, substations and the people who balance supply and demand every second.
Power plants
Coal, gas, nuclear, hydro, wind, solar, and batteries to fill the gaps.
Illustration. Every question you ask an AI service travels this whole chain. The chain is only as strong as its weakest link.
The IEA, the intergovernmental body that tracks the world’s energy, published an update on this in April 2026. It says electricity use by data centres grew by 17% in 2025, “in line with IEA projections”, and that AI-focused data centres grew faster still, by 50%.[3] It adds that the major model providers reported “a threefold increase in active users and a fivefold increase in revenue over the past year”.[3]
Cheaper per answer, bigger in total
There is an apparent paradox here, and the IEA states it plainly. Per task, AI is becoming far more efficient: energy use per AI task has been dropping by “at least an order of magnitude annually in recent years”, and a simple text query now typically consumes less electricity than running a television for the same time.[3]
But the tasks are changing. “New energy-intensive AI applications are increasingly being launched and used, such as those for video generation, reasoning and agentic tasks”, and these “can consume hundreds or thousands of times more energy per query than simple text generation”.[3] The IEA frames total demand as the product of three moving things: efficiency, uptake and changing capabilities.[3]
Per task
≥10× less a year
The IEA says energy use per AI task has dropped by “at least an order of magnitude annually in recent years”. A simple text query now typically uses less electricity than running a television for the same time.
In total
+17% and +50%
Data-centre electricity rose 17% in 2025, to 485 TWh. AI-focused data centres rose 50%.
New kinds of task
100× to 1,000×
Video generation, reasoning and agentic tasks “can consume hundreds or thousands of times more energy per query than simple text generation”.
Source: International Energy Agency, Key Questions on Energy and AI, 16 April 2026. The quotations are the IEA’s own words.
The numbers: 485 to 950 terawatt-hours
The IEA’s central projection is that electricity consumption by data centres will “roughly” double, from 485 TWh in 2025 to 950 TWh in 2030, reaching around 3% of global electricity demand, with AI-focused data centres tripling.[3] That is close to the trajectory in its first report on the subject a year earlier, which put 2030 at around 945 TWh, “slightly more than Japan’s total electricity consumption today”.[4]
- 2023360
- 2024416
- 2025485
- 2030945
Terawatt-hours a year. Source: IEA, Key Questions on Energy and AI (2026), Table A.4, with “rest of the world” worked out by subtraction. 2030 is the IEA’s Base Case projection, not a measurement.
Look at who adds the most. In the IEA’s tables, the United States grows from 224 TWh in 2025 to 426 TWh in 2030, and China from 117 TWh to 277 TWh.[3] In 2024 the United States accounted for 45% of the world’s data-centre electricity use and China for 25%.[4] The IEA expects data centres to account for around half of US electricity-demand growth through 2030.[5] India is not tabulated separately in the 2026 tables; in 2025 the IEA put India’s data centres at around 9 TWh, about 0.5% of its electricity use.[4]
A sense of scale
950 TWh sounds enormous, and it is, but it needs a yardstick. All the electricity India generates in a year is about 2,080 TWh.[2] The world’s data centres in 2030 would therefore use a little under half of what India generates today, and about 3% of the world’s electricity.
- World’s data centres, 2030 (IEA projection)945
- India, all electricity, 20252,082
- United States, all electricity, 20254,520
- China, all electricity, 202510,583
- World, all electricity, 202531,772
TWh. The dashed bar is a projection; the others are 2025 generation (Energy Institute and Ember data via Our World in Data). Data centres worldwide in 2030 would use about 3% of the world’s electricity, according to the IEA, and a little under half of what all of India generates today.
Two cautions keep the number honest. First, it is a projection with a wide cloud around it: “uncertainties widen further after 2030”, the IEA says, and it identifies a possible upside if bottlenecks ease and energy-hungry uses spread.[3][4] Second, the IEA lists real brakes on the near term: grid connections, chip supply, a shortage of high-bandwidth memory that it expects to last “through at least the end of 2027”, and a dependence on financing and market sentiment.[3]
The chart we were handed, checked
Here is the chart that was supplied with the post. It came with a link to a ChatGPT conversation titled “Global Energy Consumption Trends and Forecasts”; the page needed a log-in, so we could not see how the chart was made or what data it used. We reproduce it so that you can see exactly what we checked, not because it is a source.
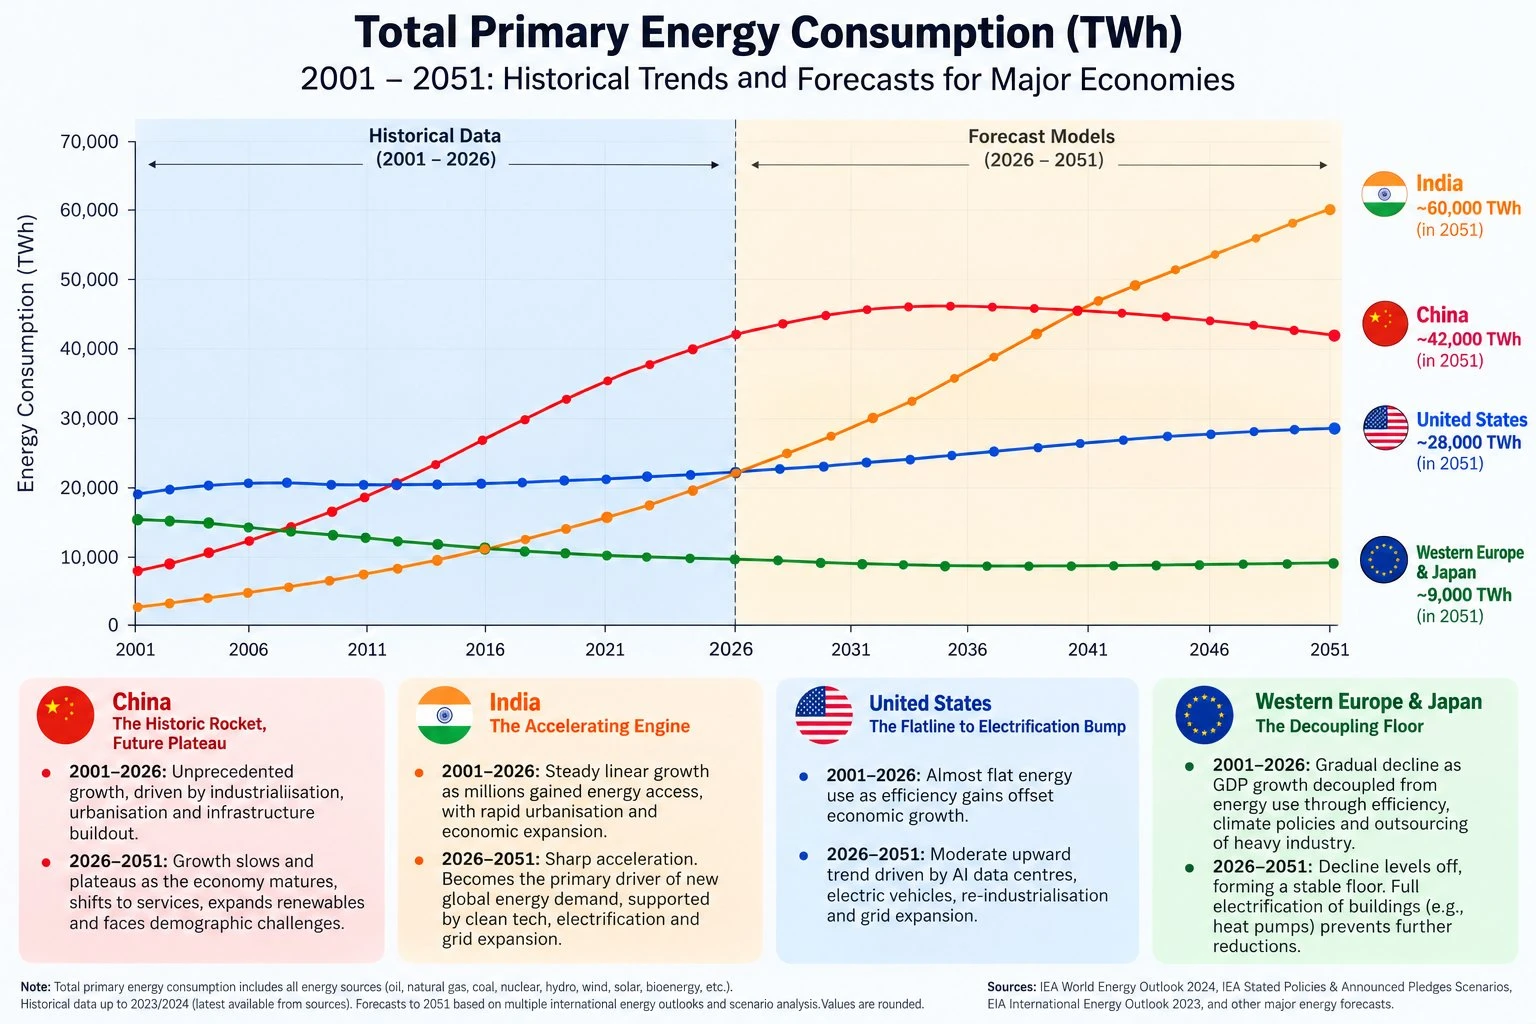
We compared it with two things: the IEA’s World Energy Outlook 2025, published in November 2025, which tabulates every country’s total energy supply in exajoules (we convert at 277.8 TWh per exajoule), and the Energy Institute’s Statistical Review figures for 2025, as published by Our World in Data and updated on 30 June 2026.[6][2]
India’s energy use passes the United States’ in 2026, at about 22,000 TWh.
Not supportedIn 2025 India used 10,861 TWh against the US’s 26,064 TWh: 42% of it. India’s figure is about half of what the chart shows.
India reaches about 60,000 TWh in 2051.
Far above bothThe IEA’s 2050 figures for India are 77.5 EJ (about 21,500 TWh) in its Stated Policies Scenario and 89.5 EJ (about 24,900 TWh) in its Current Policies Scenario. 60,000 TWh is 216 EJ.
India overtakes China around 2041.
Not supportedIn 2050 the IEA has China at 170 to 192 EJ and India at 78 to 90 EJ: China is roughly twice India’s size.
China rises, then plateaus and edges down.
Right in shapeThe IEA’s China lines rise to 2035 and then flatten or fall (Current Policies: 196.4 EJ in 2035, 191.8 in 2050; Stated Policies: 181.9 and 169.8).
The US is roughly flat, then edges up; Western Europe and Japan decline and level off.
Right in shapeThe IEA has the US at 93.0 EJ in 2024 and between 91.0 and 106.3 EJ in 2050, and the EU and Japan lower in 2050 than in 2024.
Checked against the IEA’s World Energy Outlook 2025 (Table A.6, total energy supply in exajoules, converted at 1 EJ = 277.8 TWh) and the Energy Institute and Ember data published by Our World in Data. The chart names “IEA World Energy Outlook 2024” and “EIA International Energy Outlook 2023” as sources without naming tables, so its numbers could not be traced to them.
The pattern is clear. The chart has the shape of the story broadly right: China’s demand levels off, the United States is steady, Europe and Japan edge down and India climbs. But for India, the number is wrong on any reading. In 2025 India used 10,861 TWh of energy, not about 22,000; and the United States used 26,064 TWh.[2]
Around 2001
United States
- Data25,759
- Supplied chart≈19,000
China
- Data11,935
- Supplied chart≈8,000
India
- Data3,601
- Supplied chart≈2,700
Around 2026 (chart) and 2025 (data)
United States
- Data26,064
- Supplied chart≈22,000
China
- Data45,054
- Supplied chart≈42,000
India
- Data10,861
- Supplied chart≈22,000
TWh of total energy supply. Solid bars: Energy Institute data via Our World in Data. Dashed bars: values we read by eye from the supplied chart, so treat them as approximate to within a few hundred TWh. The United States and China are in the right neighbourhood; India in 2026 is not.
The forecast is further out still. To reach 60,000 TWh by 2051 from today’s level, India’s energy use would need to grow at about 6.8% a year for 26 years. The IEA’s own scenarios have it growing at between 1.8% and 2.4% a year to 2050, ending at roughly 21,500 to 24,900 TWh.[6]
- 2024 (IEA)13,445
- 2035, Stated Policies17,778
- 2050, Stated Policies21,528
- 2050, Current Policies24,861
- 2051, the supplied chart60,000
India’s total energy supply in TWh. IEA values are exajoules from World Energy Outlook 2025 Table A.6, converted at 277.8 TWh per EJ (48.4, 64.0, 77.5 and 89.5 EJ). The IEA and the Energy Institute count some fuels differently, so IEA’s 2024 figure for India (about 13,400 TWh) is higher than the Energy Institute’s (about 10,800 TWh); each is used here on its own terms.
What the agencies say about India
Set the supplied chart aside, and the agencies’ own account of India is strong enough without exaggeration. The IEA’s World Energy Outlook 2025 uses two scenarios. The Stated Policies Scenario assumes governments do what they have announced. The Current Policies Scenario assumes only rules already in force. Neither is a prediction, and the IEA says the two present “two views on how the energy system may evolve”.[6]
Both are clear that India is a main driver of the world’s growing energy demand, together with Southeast Asia.[6] In the Current Policies Scenario, India’s energy demand “grows the fastest” of the emerging economies, at 3% a year on average to 2035, against 1.1% for China, whose growth had been 3.6% a year from 2015 to 2024.[6]
The ranking depends on the scenario, which is why we show both. From 2024 to 2035, India’s total energy supply rises by 15.6 EJ in the Stated Policies Scenario, more than any other country or region the IEA lists apart from the Asia Pacific total that contains it, against 7.4 EJ for China. In the Current Policies Scenario, China adds more (21.9 EJ against India’s 18.6).[6] Among individual countries, India and China are the two biggest additions in either scenario.
India
+15.6+18.6China
+7.4+21.9Southeast Asia
+10.1+11.1Middle East
+8.0+10.8Africa
+6.5+8.7United States
+0.3+5.3European Union
-4.3-2.8
Change in total energy supply from 2024 to 2035, in exajoules (EJ). Source: IEA, World Energy Outlook 2025, Table A.6; the differences are our arithmetic. Dashed bars are falls. The ranking of India and China flips between the two scenarios.
For electricity, the IEA’s summary is that demand “rises in all countries and regions, with the strongest growth in India and Indonesia”.[6] India’s generation goes from 2,090 TWh in 2024 to 3,687 TWh in 2035 and 5,805 TWh in 2050 in the Stated Policies Scenario. That is nearly three times today’s level, and close to the United States’ 6,237 TWh in the same year, though still far below China’s 19,696 TWh.[6]
Why the gap is the story
Here is the fact a16z’s chart is really about. In 2025 the average person in the United States had 13,015 kWh of electricity generated for them, the average person in China 7,474 kWh and the average person in India 1,422 kWh.[2]
- United States13,015
- China7,474
- India1,422
India: about 11% of the US figure and 19% of China’s.
Kilowatt-hours of electricity generated per person, 2025. Source: Ember and the Energy Institute, as published by Our World in Data (updated 30 June 2026).
If “no low-electricity country is rich” holds, then a country that wants to get richer will need more electricity per person, and India has a long way to go. That is a large part of why the agencies’ tables put India at the top of their growth rankings: not because it is the biggest today, but because it starts from little per head and has well over a billion people.
What India’s extra demand is actually made of
The IEA’s February 2026 report gives the detail. Between 2021 and 2025, India’s net electricity demand grew by close to 430 TWh. Homes and services drove half of it, industry 36%, and space cooling alone contributed 15% of the total.[5] The IEA expects demand to grow by an average 6.4% a year through 2030, “in line with IMF’s GDP forecasts”, adding over 570 TWh to annual consumption. Industry is expected to supply about a third of that growth, cooling to account for “over 20%”, and agriculture and transport together around a fifth.[5]
2021–2025 (what happened)
Of the buildings share, space cooling was 15 points of the total.
2026–2030 (the IEA’s forecast)
Cooling alone is forecast to be over 20 points. Buildings is our remainder; the IEA says its share “will decrease slightly”.
Share of the growth in India’s electricity demand. 2021–2025: buildings about half, industry 36%, with agriculture and transport “the rest”. 2026–2030: industry about a third and agriculture plus transport about a fifth, per IEA, Electricity 2026. Data centres are one of several end uses inside these groups; the IEA does not give them their own share for India.
The path is not smooth. After four years of growth above 6%, India’s demand grew only 1.4% in 2025 (the IEA’s July update revises that to 1.6%) because an early monsoon reduced cooling and farm pumping. In the first half of 2026 it rose about 6%, with a record peak of 270.8 GW on 21 May, and the IEA forecasts about 7% for the year.[5][7]
2021–2025
Net electricity demand grew by close to 430 TWh. Four years above 6%, then a slow 2025.
2025
+1.4% in the IEA’s February estimate, +1.6% in its July update. An early monsoon cut air-conditioning and pumping.
First half of 2026
About +6%, with May up 11%. Peak demand reached a record 270.8 GW on 21 May.
2026, full year
The IEA forecasts about +7%.
2026–2030
About 6.4% a year on average, adding over 570 TWh to India’s annual consumption over the five years.
Source: IEA, Electricity 2026 (February 2026) and Electricity Mid-Year Update 2026 (July 2026).
India’s data-centre moment
Against that backdrop, here is where India’s data centres stand. The IEA’s April 2025 report said India had 2 GW of installed data-centre capacity in operation as of June 2024, which had doubled in four years and consumed electricity equivalent to 6.5 million Indian households. With more than 2 GW in the pipeline for the following two years, it said, installed capacity was “on track to reach nearly 5 GW by 2030”.[4]
The IEA’s 2026 reports describe a market gaining speed: data-centre demand in India “expanded by close to 50%” in 2025, with Maharashtra home to more than half of operating capacity;[5] new tax incentives for data centres in India’s 2026 budget; and the government’s stress on expanding capacity at the AI Impact Summit it hosted in February 2026.[3]
CBRE South Asia’s report, as reported by the India Brand Equity Foundation on 7 October 2026, says India added about 130 MW of data-centre capacity in the first half of 2026 and expects more than 200 MW more in the second half, taking operational capacity to 2 GW by the end of the year. Mumbai accounted for 94% of the new supply. Investment commitments were about US$38 billion in the first half of 2026 and about US$173 billion since 2021, with more than 15% tied to AI.[8]
June 2024 (IEA)
2 GW
Installed data-centre capacity in operation, doubled in four years. About 9 TWh of electricity in 2024, or 0.5% of India’s consumption.
2025 (IEA)
≈ +50%
Growth in India’s data-centre electricity demand, as the IEA describes it. Maharashtra holds more than half of operating capacity.
H1 2026 (CBRE)
+130 MW
New capacity added in six months, 94% of it in Mumbai. More than 200 MW more expected in the second half.
End of 2026 (CBRE)
2 GW
Operational capacity CBRE expects, on its own definition.
2030 (IEA, 2025)
≈ 5 GW
Where installed capacity is “on track” to reach, as of the IEA’s April 2025 report.
Sources: IEA, Energy and AI (April 2025); IEA, Electricity 2026 (February 2026); CBRE South Asia’s report as reported by IBEF on 7 October 2026. The IEA and CBRE do not use the same definition of “capacity”, so do not read these as one series.
The companies’ announcements
Google said on 14 October 2025 that it would invest approximately US$15 billion over 2026 to 2030 in its first AI hub in India, at Visakhapatnam, which “will include a purpose-built data center campus capable of gigawatt-scale compute capacity”. It said it would work with partners “to deliver new transmission lines, clean energy generation, and energy storage systems in Andhra Pradesh”.[9] Amazon says its total investment in India between 2026 and 2030 will be US$48 billion, after adding US$13 billion for AI and cloud infrastructure that “will expand AWS data center capacity in Mumbai and Hyderabad”.[10]
All data centres, since 2021 (CBRE)
US$173 bn
Investment commitments in India’s data-centre sector, including about US$38 bn in the first half of 2026. More than 15% is tied to AI.
Google, 2026–2030
≈ US$15 bn
Its first AI hub in India, at Visakhapatnam, with a campus “capable of gigawatt-scale compute capacity”, built with AdaniConneX and Airtel.
Amazon, 2026–2030
US$48 bn
Its total for India, after adding US$13 bn for AI and cloud infrastructure, which it says will expand AWS data-centre capacity in Mumbai and Hyderabad.
These are commitments and plans announced by the companies and reported by CBRE, not money already spent. Google’s post is dated 14 October 2025. Amazon’s page follows a 25 June meeting between its chief executive and the Prime Minister, and says it builds on a US$35 bn investment announced in 2025.
How big is that, in electricity?
A little arithmetic of our own puts the capacity numbers in proportion. If India reached 5 GW of data centres and they ran flat out for every hour of the year, they would use 5 × 8,760 hours, about 44 TWh, which is 2.1% of the electricity India generated in 2025.[2] Real facilities do not run flat out, so that is a ceiling, not a forecast. Against the 570 TWh the IEA expects India to add by 2030, the extra use from data centres would be about 6% at most.
That does not make AI unimportant for India. It means that for the electricity system as a whole, cooling, industry and everyday growth are the bigger story to 2030, and that AI’s importance is in where and how reliably the power must arrive, as the next section shows.
The grid has to say yes
A data centre does not just need a lot of electricity; it needs it every hour, without interruptions. India’s grid is being asked for more of exactly that, on a hot afternoon, just as it is being asked for more cooling.
The IEA’s July 2026 update describes the pressure. Peak demand was met on 21 May, with solar PV covering 22% of the daytime peak. But “growing summer peak net load” in the evening, after the sun sets, requires coal and gas to ramp up quickly, in some cases leading to shortages, which “more than doubled” between January and May 2026 compared with the year before.[7] Spot prices reached the regulatory ceiling several times.[7]
21 May 2026, 3:45 pm
270.8 GW
A record peak load, the fourth record day in a row. It was met, with solar PV covering 22% of the daytime peak (60 GW).
The evening problem
Net load
After the sun sets, coal and gas have to ramp up fast. Shortages more than doubled in January to May 2026 against a year earlier.
Prices
Ceiling hit
Spot prices reached the regulatory ceiling of INR 10,000/MWh several times in the first half of 2026.
Supply response
+30% nuclear
New and restarted reactors are set to lift India’s nuclear generation by 30% in 2026 and 22% in 2027, the IEA says; solar is forecast +39% in 2026.
Source: IEA, Electricity Mid-Year Update 2026 (July 2026).
Data centres add their own questions. The IEA’s 2025 report says India will need to address “long-standing issues of grid reliability”, that backup and captive power generation for data centres remain “a critical consideration owing to the risk of power supply interruptions”, and that coal fuelled 74% of India’s electricity then and is likely to dominate beyond 2030, even as renewables’ share is projected to reach 35%.[4] Because India’s “open access” rules let buyers purchase power directly from generators, several technology companies are signing contracts straight with renewable producers; the report names Bharti Airtel’s data-centre arm, which planned to buy 140 GWh of renewable energy a year.[4]
So does India “lead”?
It depends entirely on what is being measured, and the agencies’ own tables let us be precise. On some measures India already leads or is about to; on others it is far behind and is not going to catch the leaders within the period the agencies cover.
Electricity generated today (2025)
Ahead China 10,583 TWh, then the US 4,520
India Third among individual countries: 2,082 TWh
Electricity per person (2025)
Ahead The US: 13,015 kWh
India 1,422 kWh, about 11% of the US
Growth in total energy demand to 2035 (IEA, Stated Policies)
Ahead India, +15.6 EJ
India First (China is first in the Current Policies Scenario)
Growth in electricity demand to 2030, in TWh (IEA)
Ahead China: “nearly 50%” of the world’s increase
India Adds over 570 TWh to its annual consumption
Growth in electricity demand to 2030, as a rate (IEA)
Ahead India, 6.4% a year (Southeast Asia 5.3%, China 4.9%)
India First
Data-centre electricity added, 2025 to 2030 (IEA)
Ahead The US, +202 TWh; China, +160 TWh
India Not tabulated separately by the IEA; small today (about 9 TWh in 2024)
Sources as in the sections above. Green cards are where India leads; amber and rose are where it does not, yet.
The honest summary has two halves. India is not the world’s biggest electricity user and will not be by 2050 on the IEA’s numbers: China is about 3.4 times India’s size in generation in 2050 in the Stated Policies Scenario (19,696 TWh against 5,805 TWh), and the United States stays slightly ahead.[6] And in data-centre electricity, the United States and China take most of the growth to 2030.[3]
But India is where the largest additions are coming from in total energy to 2035 under the IEA’s Stated Policies Scenario, where the growth rate in electricity demand is highest of the large markets (6.4% a year to 2030, against 5.3% for Southeast Asia and 4.9% for China),[5] and where the gap between today’s per-person use and richer countries’ is large. That is a different claim from “India leads”, and a more defensible one. If we had to put it in one line: India is not the world’s biggest user of power, but it is the biggest place where the extra demand is landing.
Whether AI plays a leading part in that depends on what happens to the things the IEA lists: how fast the grid can connect and supply new loads, how quickly clean power and storage are added, and whether the investment commitments announced become switched-on capacity.
What it means for you
You do not need to become an energy analyst. But a few things follow from the numbers.
- If you use AI, match the tool to the job. A simple text question costs very little; long video, deep reasoning and agent runs that browse and retry cost much more, by the IEA’s account. Use the heavy tools when the job needs them.
- If you work in technology or business, the constraint is changing. The IEA describes “a scramble for electricity, grid connections, manufacturing capacity, chips and capital” across the AI value chain.[3] Power and grid connections are becoming part of every serious AI plan.
- If you are choosing a career or a business, look at the plumbing. Power equipment, storage, transmission and cooling, and the people who keep them running, are where the scramble the IEA describes shows up.
- If you read a headline about energy, check the unit. Energy, electricity, capacity (GW) and consumption (TWh) are four different things, and most bad charts mix them.
1Capacity that is switched on
Announced gigawatts are plans. Watch quarterly operational capacity from firms such as CBRE, and ask which definition they use.
2Evening peaks
The IEA’s warnings are about the hours after sunset. Storage and fast-ramping supply are the fix to watch.
3Where the power comes from
Coal fuelled 74% of Indian electricity in the IEA’s 2025 report, with renewables forecast at 35% by 2030. Direct purchase agreements decide what new data centres run on.
4The monsoon
In 2025 an early monsoon helped hold India’s demand growth to about 1.5%, after four years above 6%. One year does not make a trend.
5The IEA’s next update
It published its first AI report in April 2025 and an update in April 2026. Check the date on any figure you read.
The message
Elon Musk’s sentence is an opinion, but its logic is sound enough to take seriously: the countries that become rich use a great deal of electricity, and AI is a new, fast-growing customer for it. India is at the start of that climb. By the IEA’s numbers it adds more energy demand to 2035 than any other country, in one of its two scenarios, and sees the fastest electricity growth of the big markets to 2030. It is also starting from 1,422 kWh a person, and its grid is already being tested on hot evenings.
The chart we were handed told a simpler and prettier story, with India overtaking the United States and then China. The real story is less dramatic and worth more: no country in the data is “leading” on every measure, the growth is real, and what happens in the next ten years will be decided less by headlines about gigawatts than by whether wires, storage and clean generation are built as fast as the data centres.
AI turns electricity into answers, and India is where the most new demand for electricity is arriving. The winners will be the places that can supply it reliably.
Quick quiz
Tap a question to check your answer.
Q1What is the difference between total energy and electricity, and which one does AI use?
Total energy counts every fuel and form; electricity is the part delivered over a wire. In 2025 electricity was about a fifth of total energy supply in India, China, the US and the world. AI runs on electricity.
Q2According to the IEA, how much electricity will the world’s data centres use in 2030, and what share of world demand is that?
Around 950 TWh, roughly double 2025’s 485 TWh, and about 3% of global electricity demand.
Q3Why does the IEA say AI can be more efficient per task but still use more electricity overall?
Energy per task has been falling by at least an order of magnitude a year, but uptake is surging and new uses such as video, reasoning and agentic tasks can use hundreds or thousands of times more energy per query than simple text.
Q4What was wrong with the supplied chart’s India line?
It showed India at about 22,000 TWh in 2026, level with the US, when the data show about 10,861 TWh in 2025 against the US’s 26,064; and it projected about 60,000 TWh by 2051, while the IEA’s scenarios give roughly 21,500 to 24,900 TWh in 2050.
Q5In what sense is it fair to say India leads, and in what sense is it not?
Fair: it has the biggest addition to total energy demand to 2035 in the IEA’s Stated Policies Scenario and the fastest electricity growth of the large markets to 2030. Not fair: it generates about a fifth of China’s electricity today, and stays far behind it in 2050.
References
The sources behind this article: original papers, official announcements and documentation. Each link was opened and checked on ; documentation without a fixed date is cited as it read that day.
- [1]
Musk, E. (@elonmusk) (10 October 2026). Electricity production is the best metric for the true strength of any large-scale economy imo. X.
Announcement · Supports: Musk’s post, the a16z post it quotes (“There are no low electricity, rich countries”) and the description of a16z’s chart; 4.5 million views when read on 12 October 2026
- [2]
Our World in Data, using Ember and the Energy Institute (updated 30 June 2026). Primary energy consumption (total energy supply, TWh), with the same site’s electricity-generation and per-capita electricity charts. Our World in Data.
Documentation · Supports: 2001 and 2025 total energy supply, electricity generation and electricity per person for India, China, the United States and the world; used to check the supplied chart
- [3]
International Energy Agency (16 April 2026). Key Questions on Energy and AI. IEA.
Reporting · Supports: Data-centre electricity 485 TWh in 2025 to about 950 TWh in 2030; +17% and +50% in 2025; energy per task, agentic tasks, bottlenecks; the regional table (Table A.4); India’s 2026 budget and the AI Impact Summit
- [4]
International Energy Agency (April 2025). Energy and AI. IEA.
Reporting · Supports: 415 TWh in 2024; shares by region; India’s data centres (about 9 TWh, 2 GW in June 2024, nearly 5 GW by 2030), grid reliability and open-access power purchases
- [5]
International Energy Agency (February 2026). Electricity 2026: Analysis and forecast to 2030. IEA.
Reporting · Supports: India’s demand growth, 2021–2025 and 2026–2030 (6.4% a year, over 570 TWh), its sources, data-centre growth in India and in the United States, China’s share of global growth
- [6]
International Energy Agency (12 November 2025). World Energy Outlook 2025. IEA.
Reporting · Supports: Total energy supply (Table A.6) and electricity generation (Table A.17) by country in the Stated and Current Policies scenarios; India’s growth in energy demand
- [7]
International Energy Agency (July 2026). Electricity Mid-Year Update 2026. IEA.
Reporting · Supports: India’s 2025 and 2026 demand growth, the 270.8 GW peak on 21 May 2026, evening net load, shortages, prices and the nuclear and solar outlook
- [8]
India Brand Equity Foundation (reporting CBRE South Asia) (7 October 2026). India likely to add more than 200 MW of new data centre capacity in H2 2026, pushing total capacity to 2 GW: CBRE. IBEF.
Reporting · Supports: CBRE’s figures for India: about 130 MW added in H1 2026, 2 GW expected by end-2026, US$38 billion and US$173 billion of commitments, more than 15% tied to AI (CBRE’s own release was not retrieved)
- [9]
Google (14 October 2025). Our First AI Hub in India, Powered by a $15 Billion Investment. Google India Blog.
Announcement · Supports: About US$15 billion over 2026–2030, the Visakhapatnam campus “capable of gigawatt-scale compute capacity”, and the transmission, clean energy and storage it says it will deliver with partners
- [10]
Amazon. Amazon announces it will invest $48 billion in India by 2030. About Amazon.
Announcement · Supports: US$48 billion total for 2026–2030, including an additional US$13 billion for AI and cloud infrastructure and AWS capacity in Mumbai and Hyderabad (the page carries no date; it refers to a 25 June meeting and to a 2025 announcement as past)
How this article was made
Researched and drafted with the help of AI assistants, checked against the sources above, and published by Mrinal Singh Raja as general information, not professional advice. Facts come from the sources listed and may change, so please check them before relying on them. Spotted a mistake? Tell us and we will correct it. Our editorial standards explain how AI is used here.
The International Energy Agency, the Energy Institute, Ember, Our World in Data, CBRE, the India Brand Equity Foundation, Google, Amazon, a16z, X and OpenAI are independent of MSRX; this article is not affiliated with or endorsed by any of them. Quotes are word for word from the linked sources. Facts were checked on 12 October 2026 and may change. Conversions between exajoules and terawatt-hours use 1 EJ = 277.8 TWh. The supplied chart is shown only so it can be checked; its figures should not be used.